Looking ahead in altitude is advantageous, and even more having an all round viewpoint to help you see sand storms from higher winds which may be nearing you. This article extends on the previous one on how to adopt observability capabilities, combining various technologies and showing how they can be coordinated to augment their benefits.
Table of Contents
- Introduction
- Enhanced visibility
- The tricky scenario (part 1)
- Instrumentation
- The tricky scenario (part 2)
- Final words
Introduction
No surprise to say that we all have a habit of pressing the on/off button when the washing machine does not respond to the selected cotton program, or when the music player’s buffer gets stuck somehow, or when our laptop freezes, and in many cases it does the trick, but wouldn’t we love not to encounter all those glitches in the first place?
Well, this sort of cheat to solve bottlenecks/hiccups is somehow still very popular in some data centres where there are some systems known to have a repeating failure pattern, and the handy cron job to schedule reboots prevents them from getting to the breaking point. However it is preferable to find and resolve the defects to improve the platform so that it can run smoother with less unexpected misbehaviour.
Finding and fixing issues is easier when only one or very few systems are involved, but can get very tricky when architectures are more complex, think for example on multiple chained systems or even more elaborated grids. How they can connect to each other reminds me how, at the molecular level, the carbon element is capable of forming very sophisticated structures. Pin-pointing where in the structure the problem originates, out of all the interconnected nodes, becomes very challenging.

The above is particularly true with distributed integrations using non-trivial communication interactions, where a given system might fire an event, for example as a detached notification to no particular endpoint, and multiple listening asynchronous processes might react, and in their turn trigger new events cascading downstream.
While monitoring (as discussed in my previous article) helps with the gathering of samples and aggregated data (health data and other key performance indicators), it doesn’t contribute much to the collection of investigation data. Additional strategies are needed to help you chase the evidence you’re looking for to resolve a particular problem, similar to the way forensic techniques are applied to solve a crime, like luminol spray is used to reveal digital prints or stains, or shifting to the field of astronomy, an optical telescope will show you a galaxy far far away (a nebula below) but will not tell you everything there is to tell. Using imagery taken from radio, x-ray and other types of telescopes, you can obtain new information to enrich the overall study of the galaxy.

In our field, vendors in the market can offer very attractive products with very sophisticated lenses to dive into the different parts involved in your platform. However here the intention is to cover technologies born in the open source spectrum and to focus on the areas of integration, services, messaging.
Enhanced visibility
When helping customers (and in my own experience) I’ve witnessed the difficulty admins have to perform good diagnosis when confronting trouble. Reporting a problem describing its misbehaviour, most of the times, is simply not enough, engineers will feel powerless without a quality collection of key data. Finding answers requires close collaboration between the operational team and developers who possess insightful knowledge. When the right tools and techniques are available to collect forensic (investigation) data, problems can be fixed and eradicated, when not, they are usually patched with workarounds, leaving behind technical debt, and increasing unreliability.
Deploying observability capabilities can almost become a plug & play affair, however they might not bring you out-of-the-box functionally to help you finding the answers you’re looking for. We will discuss some possible approaches to maximise what can be achieved by incorporating extra complements here and there.
To start with, the following picture illustrates a very effective combination of blocks to provide different lenses to use to look at the platform.

In the sections that follow we will review the technologies used and have a closer look at each one of these viewpoints, but in summary the 3 key areas are Monitoring to run health checks, log aggregation with a single pane of glass to inspect logs, and tracing in order to track the flow of inter-process communications.
The ‘tech’ involved
In essence, the concepts and principles covered in this article are technology and environment neutral, whether running the systems on bare metal, virtualised, or containers. The aim is to describe strategies to generate, analyse and visualise observability information.
However, the article is centred around integration and containers, since the former provides a framework to easily interconnect systems and the latter provides the agility and automation to accelerate operability. Hopefully, during the course of this article, you should be able at all times to detach from the given technology references and apply the concepts to your products of choice.
Let’s now get into it by doing a quick summary of the ‘tech’ we will refer to, and later dig on the specific ones that enable observability in their different areas.
 Apache Camel: the integration framework.
 Kubernetes: the container environment
 Prometheus: the metrics aggregator
 OpenTracing: the open and technology neutral tracing initiative
 Jaeger: one OpenTracing implementation

 EFK: Log aggregation with ElasticSearch + Fluentd + Kibana (EFK)
When later we get hands-on, example code snippets and snapshots are included to show how to put in practice these strategies.
I’ve chosen (for convenience) some of products from Red Hat (where I work) to model and deploy the Camel applications, namely Fuse, the integration solution, and Red Hat OpenShift, the Kubernetes based environment. With OpenShift the process of deploying and configuring building blocks becomes much easier than on a vanilla Kubernetes environment.
Let’s proceed now to cover the different observability areas and see which correspond to each group. Let’s now introduce the key observability areas presented earlier.
Monitoring
We won’t dive into Monitoring since it was a topic discussed in depth here, but before jumping straight to the next areas, let’s just highlight Prometheus, which integrates with Kubernetes, as a great choice when it comes to gather metrics from all sort of sources.
Furthermore, Prometheus in OpenShift comes now out-of-the-box, and the Camel integrations deployed with Fuse automatically expose JVM and Camel metrics (for Prometheus to scrape).

The snapshot above shows a Grafana dashboard rendering metrics stored in Prometheus obtained from a Camel integration.
Log Aggregation
Enabling log aggregation allows the collection of all output logs and prepares them to be at your disposal from a centralised console, it would be otherwise unmanageable to find the logs that you need among tens, if not hundreds, of log sources in the platform. A very effective formula used in OpenShift is to use the EFK combination: ElasticSearch, Fluentd and Kibana. These are all open source projects freely available. There is plenty of literature out there so we’ll just do an overview.
The idea is to have a very lightweight agent (Fluentd) that collects logs from every running container and sends them to ElasticSearch which is designed to store and index entries by a set of fields which can be easily retrieved and queried. Kibana is the user interface that can plug into ElasticSearch and allow the user to query the masses of collected logs from a single entry point.

This approach also brings some simplicity on how applications are developed, they no longer require to include sophisticated file logging mechanisms such as rolling sets, or compression to lower disk usage, those could be considered obsolete. Applications just need to direct the logs to the console, Fluentd will collect and structure them in JSON format which allows easier processing in ElasticSearch.
Because the downstream log format is JSON, it makes sense therefore to include a JSON log encoder in the application itself (although not mandatory). The JSON encoding permits ElasticSearch to follow an indexing and key/value access strategy. Let’s look at a log example, suppose the system logs the ‘clientID’ of the incoming request header, the code line would look similar to:
log("got request from client")
The output of the system would then be rendered in JSON as follows:
{"message":"got request from client" , "clientID":"YnJ1bm8wMQ=="}
With the JSON encoder, key information can be placed in purposed defined JSON fields. ElasticSearch uses the JSON field name as the index field, and users could open Kibana’s web console and execute queries using the ‘clientID’ as the filtering key. With many containers running, large volumes of logs are obviously being collected. ElasticSearch provides by design helpful management policies to ensure the administrator has control over storage usage.
Although EFK certainly provides an excellent approach on how to access log data, it remains challenging to come up with the right filters to isolate the exact piece of information needed when huge masses of logs per second are generated. This is mostly because every application is different and usually log contents change from system to system.
Tracing
Enabling applications to generate traceability information enriches each interaction between systems with insightul meta-data, such as timestamps or system names, but more importantly, all interactions triggered by the same event (incoming request) share the same trace identifier which then enables the possibility of reconstructing which systems the flow has traversed end-to-end.

Without tracing visualisation there’s a feeling of blindness. The source code does define the paths traffic should follow for a given input data, but in live environments, unexpected diversions occur and we loose track and visibility on the route a particular execution has taken.
The biggest challenge to enable tracing comes from the difficulty to unify all types of programming languages and technologies so that they can coordinate to generate common and consumable tracing information. This problem becomes even more relevant on container platforms where there is a greater chance to find a wider variety of engines.
An answer to this challenge is the OpenTracing initiative, a technology neutral framework to generate tracing information no matter the underlying technology used. It defines a language agnostic framework on how an application should produce the tracing data.
In integration architectures, tracing should not be limited to HTTP transmissions, it should be able to cross to other communication protocols as well. Typically messaging is a good example, you may have services that require to expose HTTP as an entry point but then send asynchronous events to indirect applications that might be interested. The aim of tracing is to obtain the full picture of all inter-related systems.
Note about Service Meshes
The term Service Mesh is very popular in recent times. Of course a mesh of services, strictly speaking, is nothing else than the collection of inter-related services deployed as independent entities. But the term here refers more specifically to a mesh that has been wired underneath, in the less intrusive possible way, to help alleviate strain on developers and operators to make the mesh easier to manage. This is particularly important as the number of services grows.

One of the key capabilities of a Service Mesh is observability, and therefore very relevant to this discussion. Probably the most prominent example of a Service Mesh implementation is Istio which actually includes many of the open source technologies referenced above (i.e OpenTracing and Jaeger).
However, I won’t dive into Istio, for two main reasons. First because the aim of this article is more to center the reader’s attention on how to enhance the use of observability capabilities (in general terms) to really get most out of it. And the second reason because, in the case of Istio at present, the fact that it is mainly HTTP focussed and not easily adaptable to multi-protocol communications.
There are real needs to extend Service Meshes towards non-HTTP edges, for this reason the Istio project tries to push forward and find strategies to go beyond the HTTP protocol. An example of this is the work of Alain Conway, a colleague from Red Hat, who has been working on integrating with AMQP endpoints, this would fit well for a number of use cases. For more information, jump to the following GitHub link.
The tricky scenario (part 1)
To illustrate the value good observability brings, let’s describe for instance one of those critical situations where an unknown problem is causing a loss of revenue and hence affecting business. In this example (based on real experience), a partner (or client to the platform) is reporting an anomaly: they’re sending traffic to our systems and some of the obtained responses are not successful, however all of the traffic is flowing with normality end-to-end, with no delays and no errors being thrown.
Under such scenario, all the dashboards look normal, no error codes are being returned and no error logs generated. It is a difficult problem to solve because this behaviour has only been seen in the production environment where the flowing traffic is mixed, from a variety of services belonging to different teams and product owners. The platform is an integration layer between clients and backend services. At first, when the partner raised the problem, the investigator contacted the team operating the backend system handling the payments, but again, no faults or red indicators were observed there.
You’re possibly thinking -how is it possible the client is reporting errors nobody else is able to see?-. Well, let me give you more background to answer that. Years earlier, the main backend ‘Payment’ service already existed, with many clients already integrated. There was then a commercial demand to add new functionality on top, and whether right or wrong, the architects decided to build new components in between, preserving the client/server interface untouched following a non-intrusive approach, and still fulfilling the new business requirements. This strategy ensured the company could stay well within the original contractual terms with partners and clients consuming the service.

From the animation above you can observe how the original interface is kept intact with the addition of new components. The integration was implemented as a pass-through where the backend always responds with an HTTP code 200 (HTTP success). However, the true ‘result’ indicator happens to be placed in a field ‘status’ inside the response payload which can take the value ‘success’ or ‘failure’. The backend system considers both values as valid scenarios, in other words a ‘failure’ is not an error, a possible reason for instance could be ‘insufficient balance’.
System errors generally indicate something did not quite go as expected, but a payment success or failure can both be expected use cases. For instance, when a system attempts to write to disk and this operation fails, due to insufficient space for example, then an exception would be raised, and this would then be treated as a genuine error.
With the above reasoning in mind and resuming with the example scenario, the client was expecting a success but instead the response given by the integration layer was:
HTTP/1.1 200 OK
Content-Length: 47

<payment>
  <status>failure</status>
</payment>
where the obtained response is a successful HTTP code with some payload. We can now understand how the reported problem did not trigger any alarms or red flags.
For the personnel investigating the problem the enigma remains unresolved, the incoming traffic appears to be healthy and the backend systems seem to be working with normality. Unfortunately none of the teams (clients and backend) can collaborate further because (for security reasons) identity fields are obfuscated, making it not possible to pin-point the right samples.
You need good observability strategies that enable the teams to investigate deep in situations like the one described. We continue now with some technical descriptions, and further down we will retake this problem scenario to find a resolution path.
Instrumentation
To enable observability, applications require instrumentation, the goal being, to extract data and measurements such as timestamps, memory footprint, system hops, service usage, throughput, and others.

All these measurements can then be pushed to data crunching systems and dashboards for analysis. Sometimes the runtime on which the application executes already generates the information needed and the instrumentation left to do just consists in pure extraction, and some other times the information is not available at all and needs both, to be generated and then be extracted. For example a JVM (Java Virtual Machine) already exposes MBeans collecting monitoring metrics such as threads and memory usage. In this case, part of the instrumentation is already built-in, leaving the extraction process pending to be hooked. Tracing information on the other hand is generally not available out-of-the-box, so the application requires a full instrumentation implementation.
In the integration space, our technology of choice is Apache Camel, and we’re lucky because it already ships with everything needed and requires very little extra instrumentation to benefit from all the capabilities discussed here.
Let’s cover how observability can be enabled in Apache Camel, focussing on tracing and log aggregation since metric monitoring was well covered in my previous article.
Tracing Camel
Apache Camel has embraced the OpenTracing initiative. As an integration framework, Camel may be connecting to many different endpoints written in different languages and running on different technologies, but all systems together as an end-to-end process, collaborate to deliver the same service goals. It makes a lot of sense they all share a common technology-neutral tracing framework.
Enabling tracing for a single and isolated application isn’t that useful, but for pure simplicity, let’s build a very thin and dummy instrumented service to illustrate how it is done. Later in the article, we will come back to our ‘tricky’ scenario and discuss an approach to have it addressed.
The dummy service simply exposes REST, and executes a log instruction when a request arrives. The instrumentation automatically generates the tracing information and sends it to a tracing console.

There are various ways to switch-on tracing in Camel, but we’re taking a shortcut and describing how to do it using Jaeger’s agent. This, to the Camel application, is nothing else than another Maven dependency, but Jaeger will interact with the OpenTracing API to collect and manipulate the information generated by Camel itself.
The picture that follows details the Camel project we’re about to construct and how it needs to be instrumented:

The steps are simple:
- Create a Camel project
- Include tracing configuration (3 params)
- Annotate the Camel project (1 tag )
- Include dependencies (3 of them)
That can’t be too complicated.
All right, I like to do things from scratch, so that we actually do some real work !
Let’s go !
Using Fuse archetypes, let’s create the base project:
mvn org.apache.maven.plugins:maven-archetype-plugin:2.4:generate \
-DarchetypeCatalog=https://maven.repository.redhat.com/ga/io/fabric8/archetypes/archetypes-catalog/2.2.0.fuse-710017-redhat-00003/archetypes-catalog-2.2.0.fuse-710017-redhat-00003-archetype-catalog.xml \
-DarchetypeGroupId=org.jboss.fuse.fis.archetypes \
-DarchetypeArtifactId=spring-boot-camel-xml-archetype \
-DarchetypeVersion=2.2.0.fuse-710017-redhat-00003
you’ll be prompted to enter the coordinates, for instance:
groupId: org.demo
artifactId: demo
version: 1.0.0
Once the skeleton generated, add the following dependencies in the POM file:
<!-- Camel Servlet -->
<dependency>
  <groupId>org.apache.camel</groupId>
  <artifactId>camel-servlet-starter</artifactId>
</dependency>

<!-- Tracing dependencies -->
<dependency>
  <groupId>org.apache.camel</groupId>
  <artifactId>camel-opentracing-starter</artifactId>
</dependency>
<dependency>
  <groupId>io.jaegertracing</groupId>
  <artifactId>jaeger-client</artifactId>
  <version>0.32.0</version>
</dependency>
<dependency>
  <groupId>io.opentracing.contrib</groupId>
  <artifactId>opentracing-agent</artifactId>
  <version>0.4.0</version>
  <scope>provided</scope>
</dependency>
Now edit the main ‘Application’ class located here:
src/main/java/org/demo/Application.java
and annotate it with the ‘@CamelOpenTracing’ tag (and the corresponding import). Your code should look similar to:
...
import org.apache.camel.opentracing.starter.CamelOpenTracing;

@CamelOpenTracing
@SpringBootApplication
// load regular Spring XML file from the classpath that contains the Camel XML DSL
@ImportResource({"classpath:spring/camel-context.xml"})
public class Application {
Next… Jaeger’s client needs some environment variables to be set in order to connect with Jaeger’s collector, so we define them as follows in preparation for the deployment in OpenShift. The Camel project includes a resource file where we can define environment variables from where the deployment process reads and handles them for us.
Open the the following YAML file:
src/main/fabric8/deployment.yml
and include the following content at the end:
Attention! ensure the indentation in your YAML file is correct !
          - name: JAEGER_SERVICE_NAME
            value: 'demo'
          - name: JAEGER_AGENT_HOST
            value: 'jaeger-agent'
          - name: JAEGER_SAMPLER_PARAM
            value: '1.0'
The parameter ‘JAEGER_SERVICE_NAME’ identifies the service within Jaeger, ‘JAEGER_AGENT_HOST’ is the host where the collector runs, and ‘JAEGER_SAMPLER_PARAM’ sets the sampling rate to 1.0 (100%) which indicates every request hitting the service will be recorded and traced by Jaeger.
Let’s now work on the Camel Spring XML file:
scr/main/resources/spring/camel-context.xml
Replace the default CamelContext with the following one that includes the REST service definition:
<camelContext id="camel" xmlns="http://camel.apache.org/schema/spring">

  <rest>
    <get uri="/demo/{client-id}">
      <to uri="direct:main"/>
    </get>
  </rest>

  <route id="main">
    <from uri="direct:main"/>
    <log message="got request from client: ${header.client-id}"/>
  </route>

</camelContext>
The above defines a GET operation in REST with an input parameter ‘client-id’. The implementation invokes the main route, which simply logs the ‘client-id’ that has been sent.
Done !
Let’s check the implementation works as expected. Run locally the application with the following maven command:
mvn spring-boot:run -DJAEGER_SERVICE_NAME=demo
Note how when running locally we explicitly set Jaeger’s service name as a parameter. If we don’t, Jaeger would log a warning at start up time.
When the application has fully started, execute the following curl command to send a request that includes the client ID in its URL:
curl http://localhost:8080/camel/demo/user-1
You should see the application’s output showing the client ID that was sent:
00:51:36.269 [...] INFO main - got request from client: user-1
The integration flow is now ready to be deployed in OpenShift, and instrumented to genererate tracing information that can be inspected from Jaeger’s web frontend/UI.
Visualising Traces
We switch now to OpenShift’s environment, and we have two action points to complete before we can try out our integration application:
- Deploy Jaeger’s running elements.
- Deploy our Demo application.
1. Deploy Jaeger in OpenShift
For demo and simplicity purposes we will use an all-in-one Jaeger deployment, following Jaeger’s ‘Development Setup’.
Good-to-know: there is a Jaeger operator available to help you install and operate Jaeger deployments.
Once logged into OpenShift, create a new namespace to deploy Jaeger, for instance:
oc new-project tracing-demo
and then deploy Jaeger executing the following command:
oc process -f https://raw.githubusercontent.com/jaegertracing/jaeger-openshift/master/all-in-one/jaeger-all-in-one-template.yml | oc create -f -
as simple as that !
2. Deploy the Demo Camel application
To deploy the integration we constructed, execute the following Maven command, using Fabric8’s ‘deploy’ action and activating the ‘openshift’ profile:
mvn fabric8:deploy -Popenshift
Note: if it is the first Fuse deployment in the environment, this action may take some time to complete while OpenShift downloads the images in the background.
Good-to-know: the source-to-image workflow to deploy applications on OpenShift, for all types of languages, is being unified with the new OpenShift-Do command-line tool (
odo).
When the command returns, expose the service so that we can later send a test request:
oc expose service demo
From your OpenShift web console, navigate to our newly created namespace and you should see both instances up and running:

Let’s now send an HTTP request to force some work to be done, and then visually validate the data on the Tracing UI.
Obtain the route URL to make external calls, by running the following ‘oc’ command:
oc get route demo
and then trigger a request with ‘curl’ as follows:
curl {demo-route-url}/camel/demo/user-1
where ‘demo-route-url’ is the HTTP route you obtained earlier.
Jaeger should have recorded data after executing the command above, open the UI console by clicking on Jaeger’s route URL in OpenShift’s console (the 2nd link in the snapshot above).
You should already see the ‘demo’ service pre-selected, if not, open the drop down box to find it.

Click the button ‘Find Traces’ down below. This should find the trace corresponding to the curl command we executed earlier:

If we click on it, it will show the Span details within the application, where the 1st Span (orange line) represents the REST DSL entry point in Camel, the 2nd Span the client call to the ‘main’ process, and the 3rd Span the server, that is, the ‘main’ Camel route as defined in our implementation. To reveal more information about a Span, you can click on it to see its details.

As we can observe, we do have visibility of inner inter-process invocations within applications, this is good if we also need to investigate internal execution paths, but what we’re really after is tracing interactions between different systems which we will analyse when revisiting our ‘trouble’ scenario.
Enhancing log aggregation
If you’re in an OpenShift environment, by default there is nothing really to do to instrument your application to obtain aggregated logging, just make sure the capability is enabled (if not, talk to your administrator). If you’re not on OpenShift you’ll have to deploy and configure all the components by yourself, but we won’t get into such details in this article.
As mentioned earlier, OpenShift uses EFK (ElasticSearch, Fluentd, Kibana) to collect all the output logs from the running containers and makes them available from a web console from where you can display them and apply filters. Because EFK extracts metadata from Kubernetes, it automatically applies some categorisation on the collected logs so that you can customise your view using default key/value pairs (i.e. namespace, application name, etc.). All of this is provided out-of-the-box, with no effort to spend on instrumenting the application.
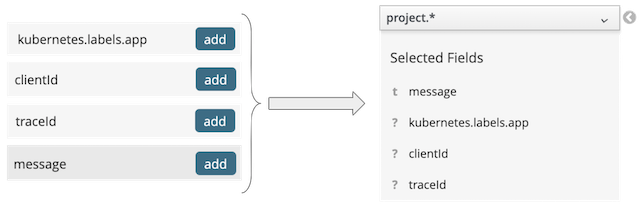
Since we’ve just deployed our ‘demo’ integration, let’s open in OpenShift’s Kibana dashboard and check some of the collected logs. I’ve sent beforehand several requests with different client IDs (user-1, user-2, etc.), and I’ve configured the view to collect the last 15mn of logs and selected the following column names:

However, since this is a cluster with many other containers deployed, Kibana returns more than 20.000 hits. When scrolling down, we can spot few of the entries corresponding to our ‘demo’ instance:

Having so many entries on screen is obviously chaotic, but what ElasticSearch then allows you to do is to apply filters by entering search expressions, in our case, if we want to only display logs from our demo instance we should apply the following filter:
kubernetes.labels.app:demo
And this would find us only the ‘demo’ logs, an improvement already:

Now imagine our system, running in a live environment, handles tens or hundreds of requests per second, we would still struggle to find what we want. You can always refine your search expression with comparison evaluations, but they could become a bit heavy to process. Ideally you’d like to filter using directly the keys.
The way to go is to include some instrumentation to generate keys that we consider valuable for log searches, so let’s revisit our implementation and make some amendments.
As previously mentioned, ElasticSearch ingests JSON structured information generated by Fluentd when collecting logs from containers. What we intend to do, is to directly generate JSON logs so that we purposefully include new JSON fields containing key data. The steps below show how to enable the JSON encoder in Logback, and in the source code how to map the relevant values.
First of all, include the needed POM dependencies for Logback:
<!-- Aggregated logs using JSON -->
<dependency>
  <groupId>ch.qos.logback</groupId>
  <artifactId>logback-core</artifactId>
  <version>1.2.3</version>
</dependency>
<dependency>
  <groupId>ch.qos.logback</groupId>
  <artifactId>logback-classic</artifactId>
  <version>1.2.3</version>
</dependency>
<dependency>
  <groupId>ch.qos.logback</groupId>
  <artifactId>logback-access</artifactId>
  <version>1.2.3</version>
</dependency>
<dependency>
    <groupId>net.logstash.logback</groupId>
    <artifactId>logstash-logback-encoder</artifactId>
    <version>5.2</version>
</dependency>
then include the following class in the following project folder:
src/main/java/org/demo/MyLogger.java
with the following definition:
package org.demo;

import org.apache.camel.Exchange;
import org.slf4j.Logger;
import org.slf4j.LoggerFactory;
import static net.logstash.logback.argument.StructuredArguments.*;

public class MyLogger {
  private static final Logger logger = LoggerFactory.getLogger(MyLogger.class);

  public void info(String message, Exchange exchange) throws Exception {
    String clientId = exchange.getIn().getHeader("client-id", String.class);
    logger.info(message, value("clientId", clientId));
  }
}
Above you can notice how the ‘client-id’ header is extracted and passed as a parameter to the log instruction.
Then configure Logback under:
src/main/resources/logback.xml
by replacing the default "STDOUT" appender by the following one:
<appender name="STDOUT" class="ch.qos.logback.core.ConsoleAppender">
  <encoder class="net.logstash.logback.encoder.LogstashEncoder"/>
</appender>
Finally, edit your CamelContext XML file located at:
src/main/resources/spring/camel-context.xml
1) include the following bean definition (outside the CamelContext node) to use the newly created logger
<bean id="logger" class="org.demo.MyLogger"/>
2) comment out the <log> statement, and replace with the invocation to the new logger:
<!-- <log message="got request from client ID: ${header.client-id}"/> -->
<bean ref="logger" method="info(got request)"/>
Note there is no need to print out the ‘
client-id’ header, as the logger will do it for us, in a separate JSON key/value pair.
If you start locally an instance, you’ll observe all the logs are now in JSON format.
You can now redeploy the integration in OpenShift with:
mvn fabric8:deploy -Popenshift
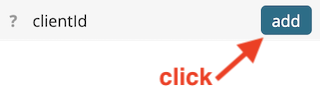
Once the new version is deployed, send few new requests, and refresh your Kibana search, you should see a new key listed in the left column, click on it to add it as a column:
by running the following filter:
clientId:"user-2"
you should obtain the following result:

where only “user-2” results are displayed, and the printed ‘message’ is a lot cleaner.
The tricky scenario (part 2)
We just learnt how to tweak logging a bit so that it is easier to laser focus on what we’re really interested in. Let’s now go back to the Payment scenario presented earlier where the operators were having difficulties to understand what the problem was.
Remember the following key difficulties:
- Random unsuccessful payments.
- Obfuscated IDs (not easy to track affected users).
- Millions of log entries.
- No obvious errors observed.
The investigation
Ok, so we agree that if we instrument the integration layer as we learnt in the earlier sections we could perhaps shed some light on what’s going on here. In order to illustrate the example with clarity I’ve recreated the scenario by building and deploying thin and simple services but replicating the same connectivity and instrumented as discussed. The resulting flow is like the one previously presented:

The new enhanced Payment service adds an integration composition that is able to receive payment requests with an obfuscated client-id (in base64 to simplify), and the sequence of steps to resolve the service is as follows:
- The process invokes the Identity service to obtain a clear client-id.
- Then it calls the Promotion service to check if the tuple client/content is eligible for a discount.
- With or without a promotion code, it then calls the Payment service to execute the transaction.
- Finally, a notification (via messaging) is fired, for other interested systems to react.
The notification (4) is sent via AMQP, and for illustration purposes a couple of systems have been added:
- a ‘Loyalty’ system, to maintain a loyalty status for the client.
- a ‘Fraud’ system, to ensure no fraudulent activity is harming the business.
When all of these systems have been deployed, the namespace in OpenShift look as follows:

Let’s fire a request, and simulate an investigation that could lead us to its resolution.
curl -X POST \
--header 'Content-Type: application/xml' \
--header 'Accept: application/xml' \
--data \
"<payment> \
    <client-id>YnJ1bm8wMQ==</client-id> \
    <content-id>ultimate</content-id> \
 </payment>" \
http://{svc-payment-route-url}/camel/payment/service
The above HTTP request pretends to be the one sent by the partner, who would have let us know the value of the ‘client-id’ sent, obfuscated at this point [YnJ1bm8wMQ==].
The first thing we can do is to look in Kibana’s console for the trace matching the client-id, by applying the following filter:
clientId:YnJ1bm8wMQ==
The above would give us the logs from the integration Payment service. The view can be configured with the following fields:
which give us the following result:

Immediately we can spot the column ‘traceId’ which corresponds to the tracing identifier. This is the tracing id generated by the instrumentation in the Camel project.
As we learnt in our first easy demo, we can enrich the logs by adding custom JSON fields which we could use in ElasticSearch to search and filter. The Payment simulation enhances the logs with a second custom field, Jaeger’s trace-id (auto-generated), and this is how it is extracted to populate the traceId JSON field in the logs:
String traceId = exchange.getIn().getHeader("uber-trace-id", String.class).split(":")[0];

logger.info(
    message,
    value("traceId",  traceId),
    value("clientId", clientId),
    ...
);
We can use the trace-id to open the Tracing visualisation of the integration flow. The URL below shows the traceId at the end of the URL
https://{url-jaeger-ui}/trace/5dc43137830aa90a
where {url-jaeger-ui} is the address of the UI console, and which gives us the following rendering:
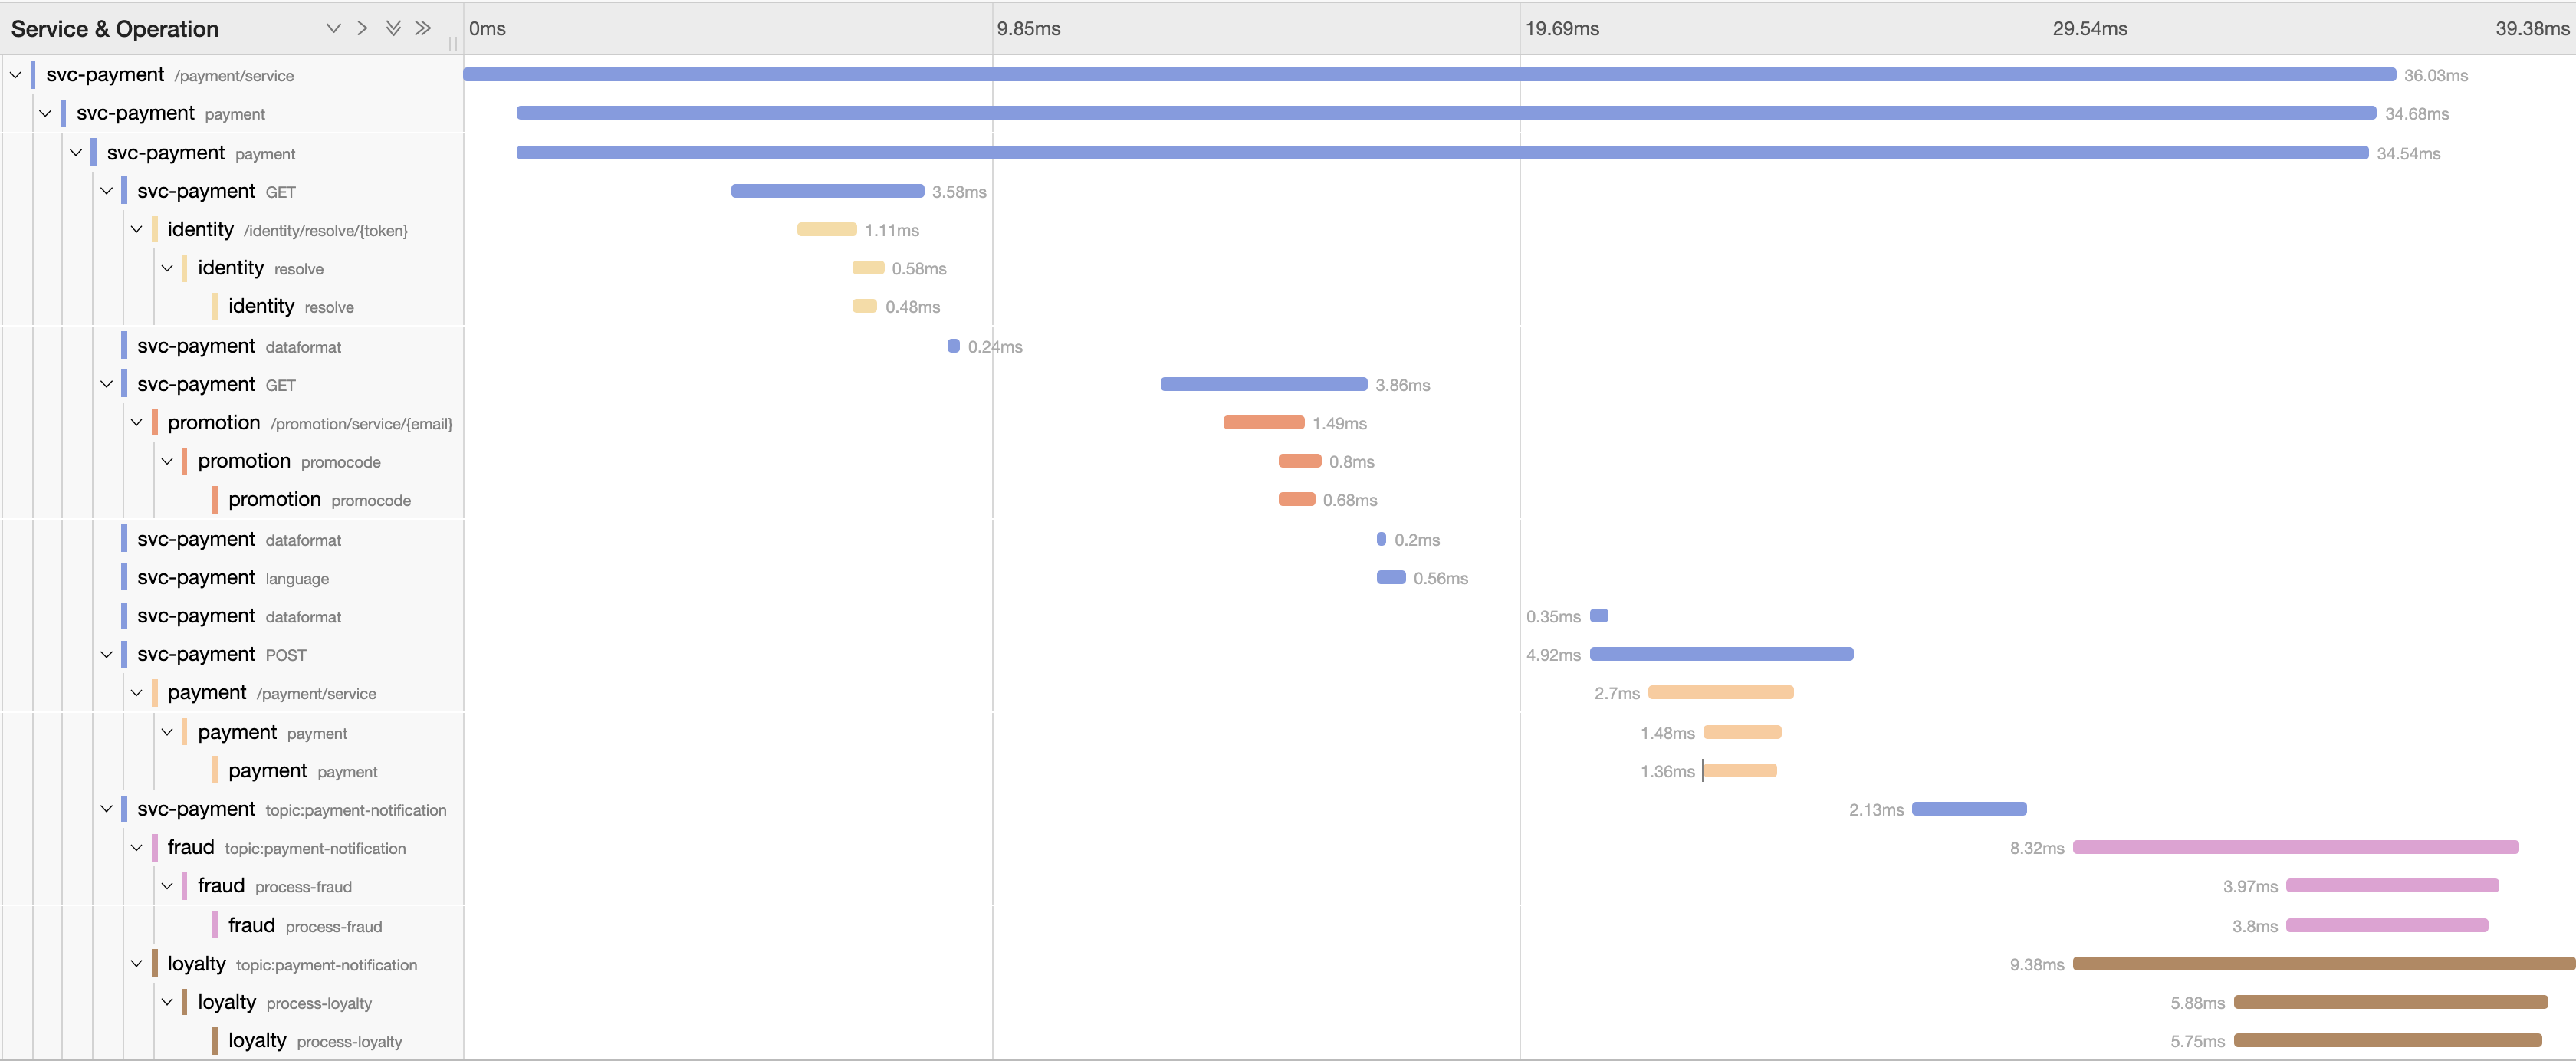
The diagram shows exactly all the systems the interaction has traversed. We can see the top Span stretching all along as the process calls sequentially the services Identity, Promotion and Payment. Then the asynchronous notification triggers the Loyalty and Fraud systems, which execute in parallel reacting to the multicast event, and live a bit longer.
So, the tracing instrumentation has liaised all these systems allowing us the chance to inspect their relationship. By looking at the graph, the operators will quickly familiarise themselves with the systems involved, and can expand in the UI each one of the Spans to get further details about the nature of the communications, and other relevant information.
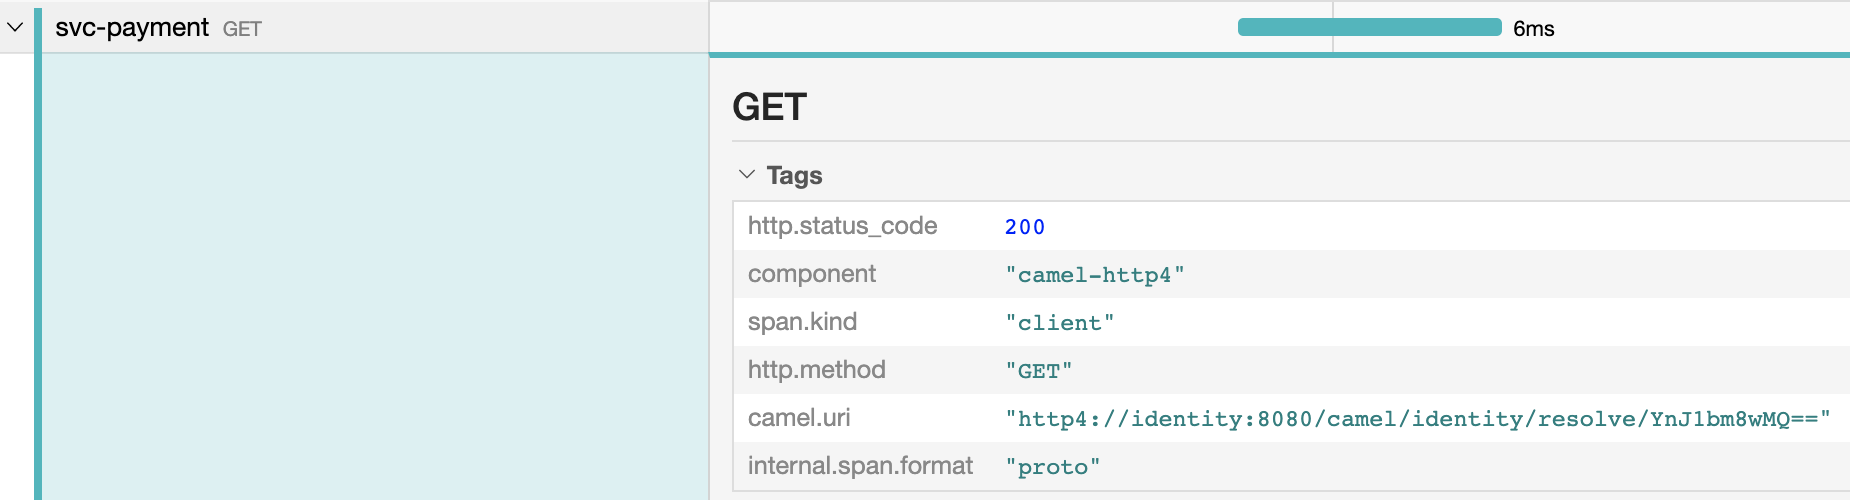
For instance, if they want to inspect details about the invocation to the Identity service, they can click on the span and they could see the following:
Important !
Note tracing information is not limited to HTTP transmissions, but other communication protocols as well. Cross protocol tracing is automatically handled in Camel when instrumented with OpenTracing and Jaeger. In our simulation the main composition workflow sends a non-HTTP asynchronous message. Operators can expand the Span information and see the message was sent via AMQP as a topic, as the picture below shows:
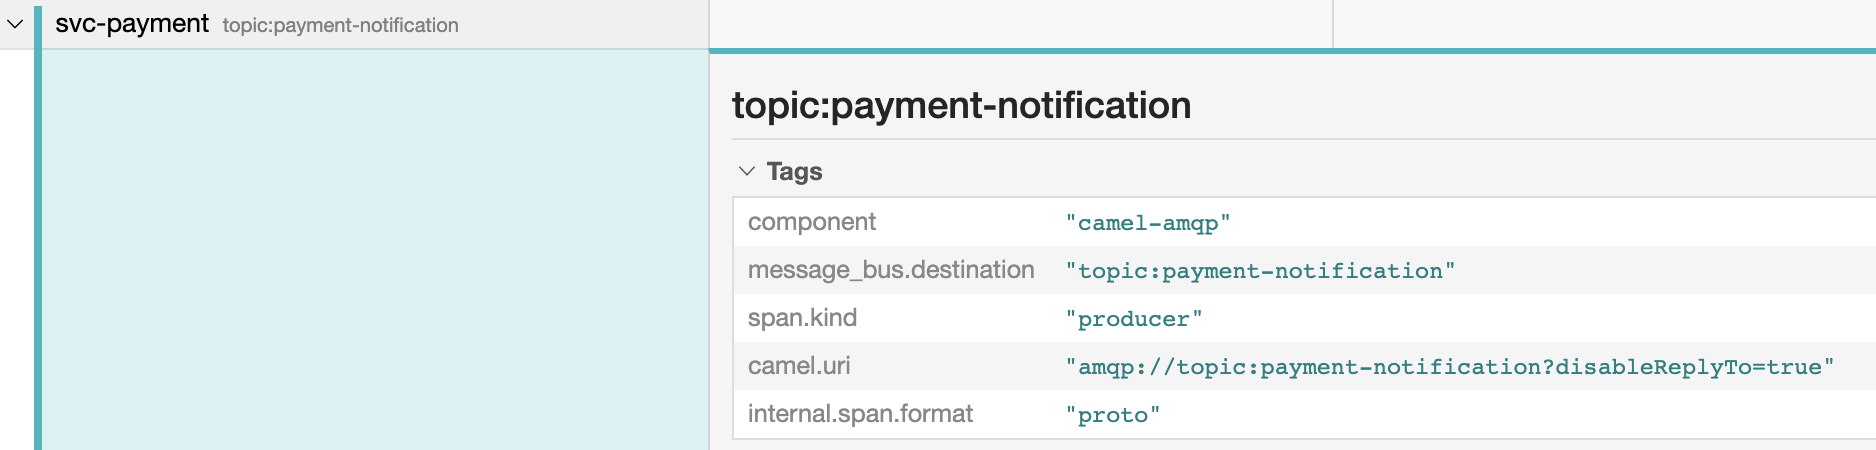
The receiving AMQP listeners (Fraud and Loyalty services) are also participating in the end-to-end interaction and tracing spans are also visible in the console.
Versatile integration architectures require, not only the classic HTTP request-reply interactions, but also non trivial ones, like fire-and-forget or publish-subscribe. With OpenTracing, the full end-to-end interaction can be tracked giving a greater chance to resolve problems.
On top of it all, since the instrumentation has equipped all the services to have access to the traceId, all the logs can then be correlated and grouped in Kibana, having a end-to-end view of the logs as they occurred in time.
If we now use the same TraceId to filter the entry logs, by entering the following filter:
traceId:5dc43137830aa90a
We obtain the following list:
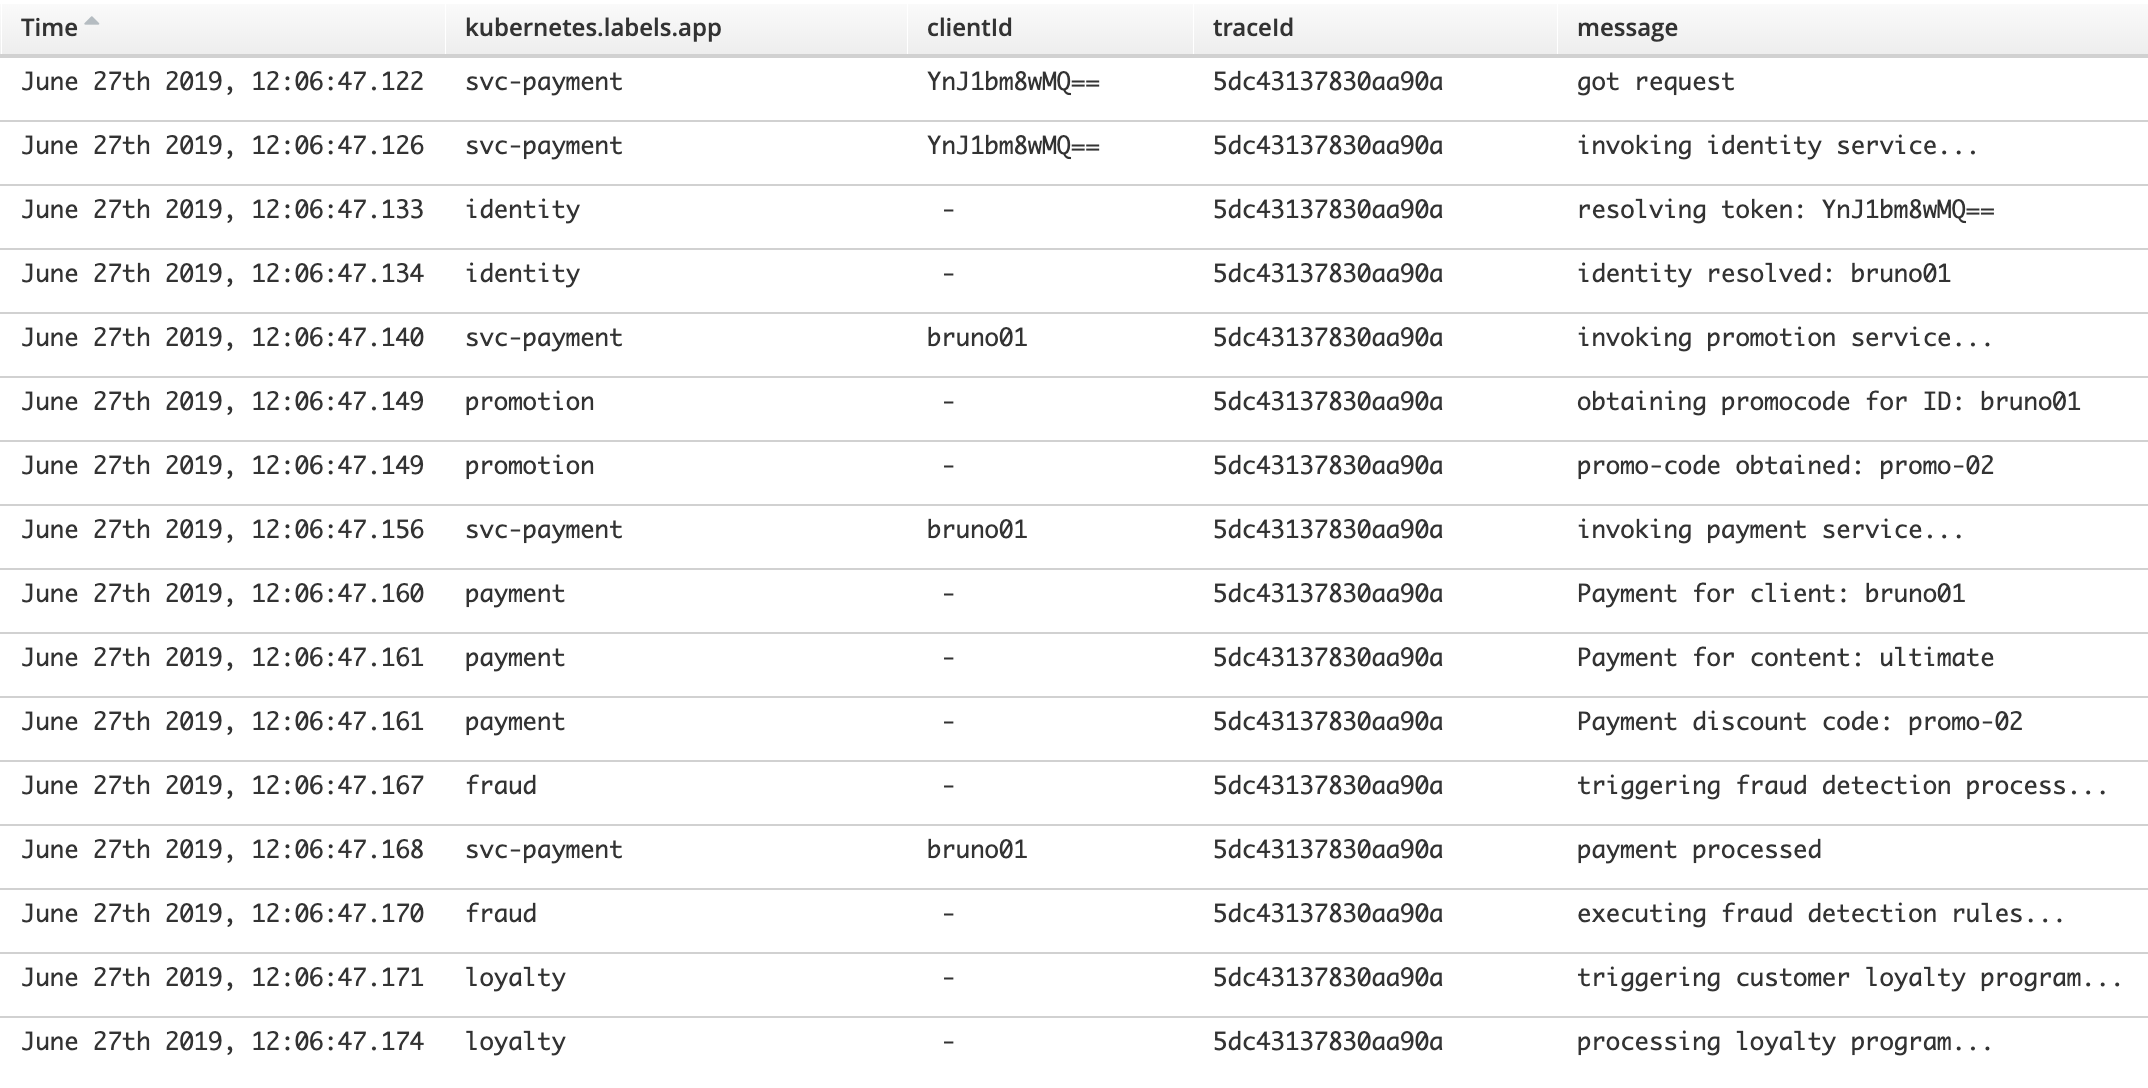
Operators will have a view of all systems involved and will also see revealed on the new result the de-obfuscated client-id, which now they can pass to backend’s Payment service maintenance team to investigate.
When the Payment’s team comes back with new info, they explain the payment request was sent with an unknown promotion code their system rejects, hence failing the payment. Operators can validate their answer, they can enrich the view adding the payload key:
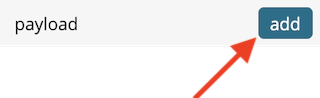
And they should see the following:
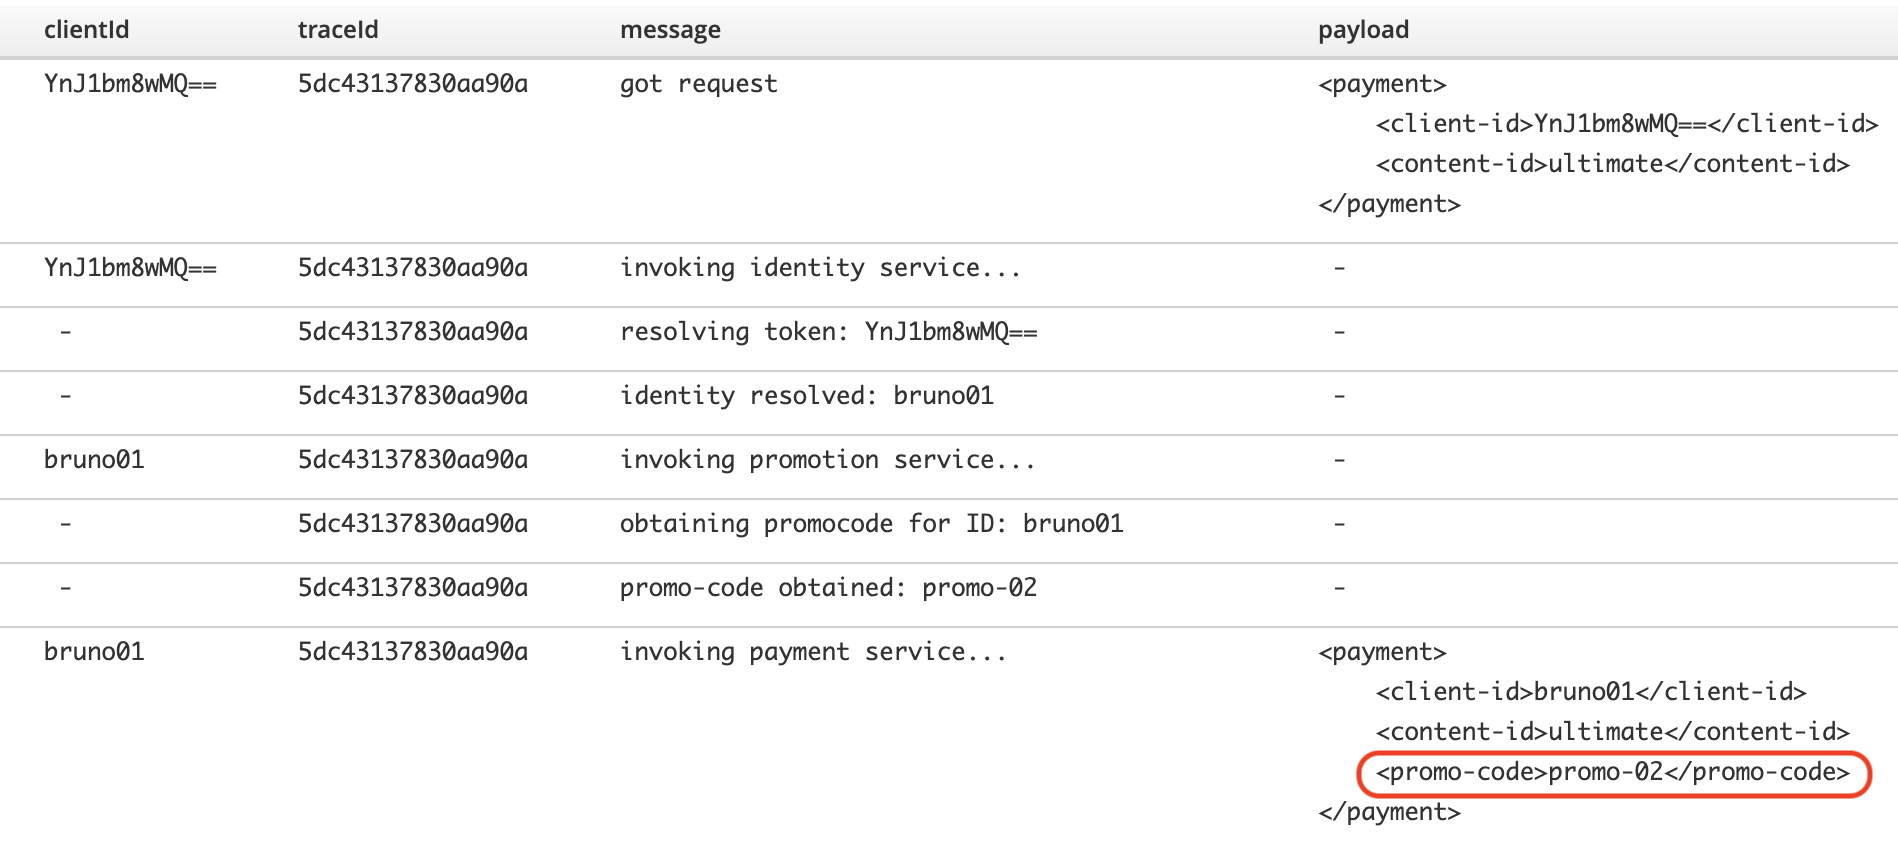
Aha! I’ve also added the payload as a custom JSON field.
By comparing both the incoming payload and the outgoing payload targeting the Payment system, they can see (circled in red above) the promotion code field the Marketing team is referring to.
Operators get to see now the full picture:
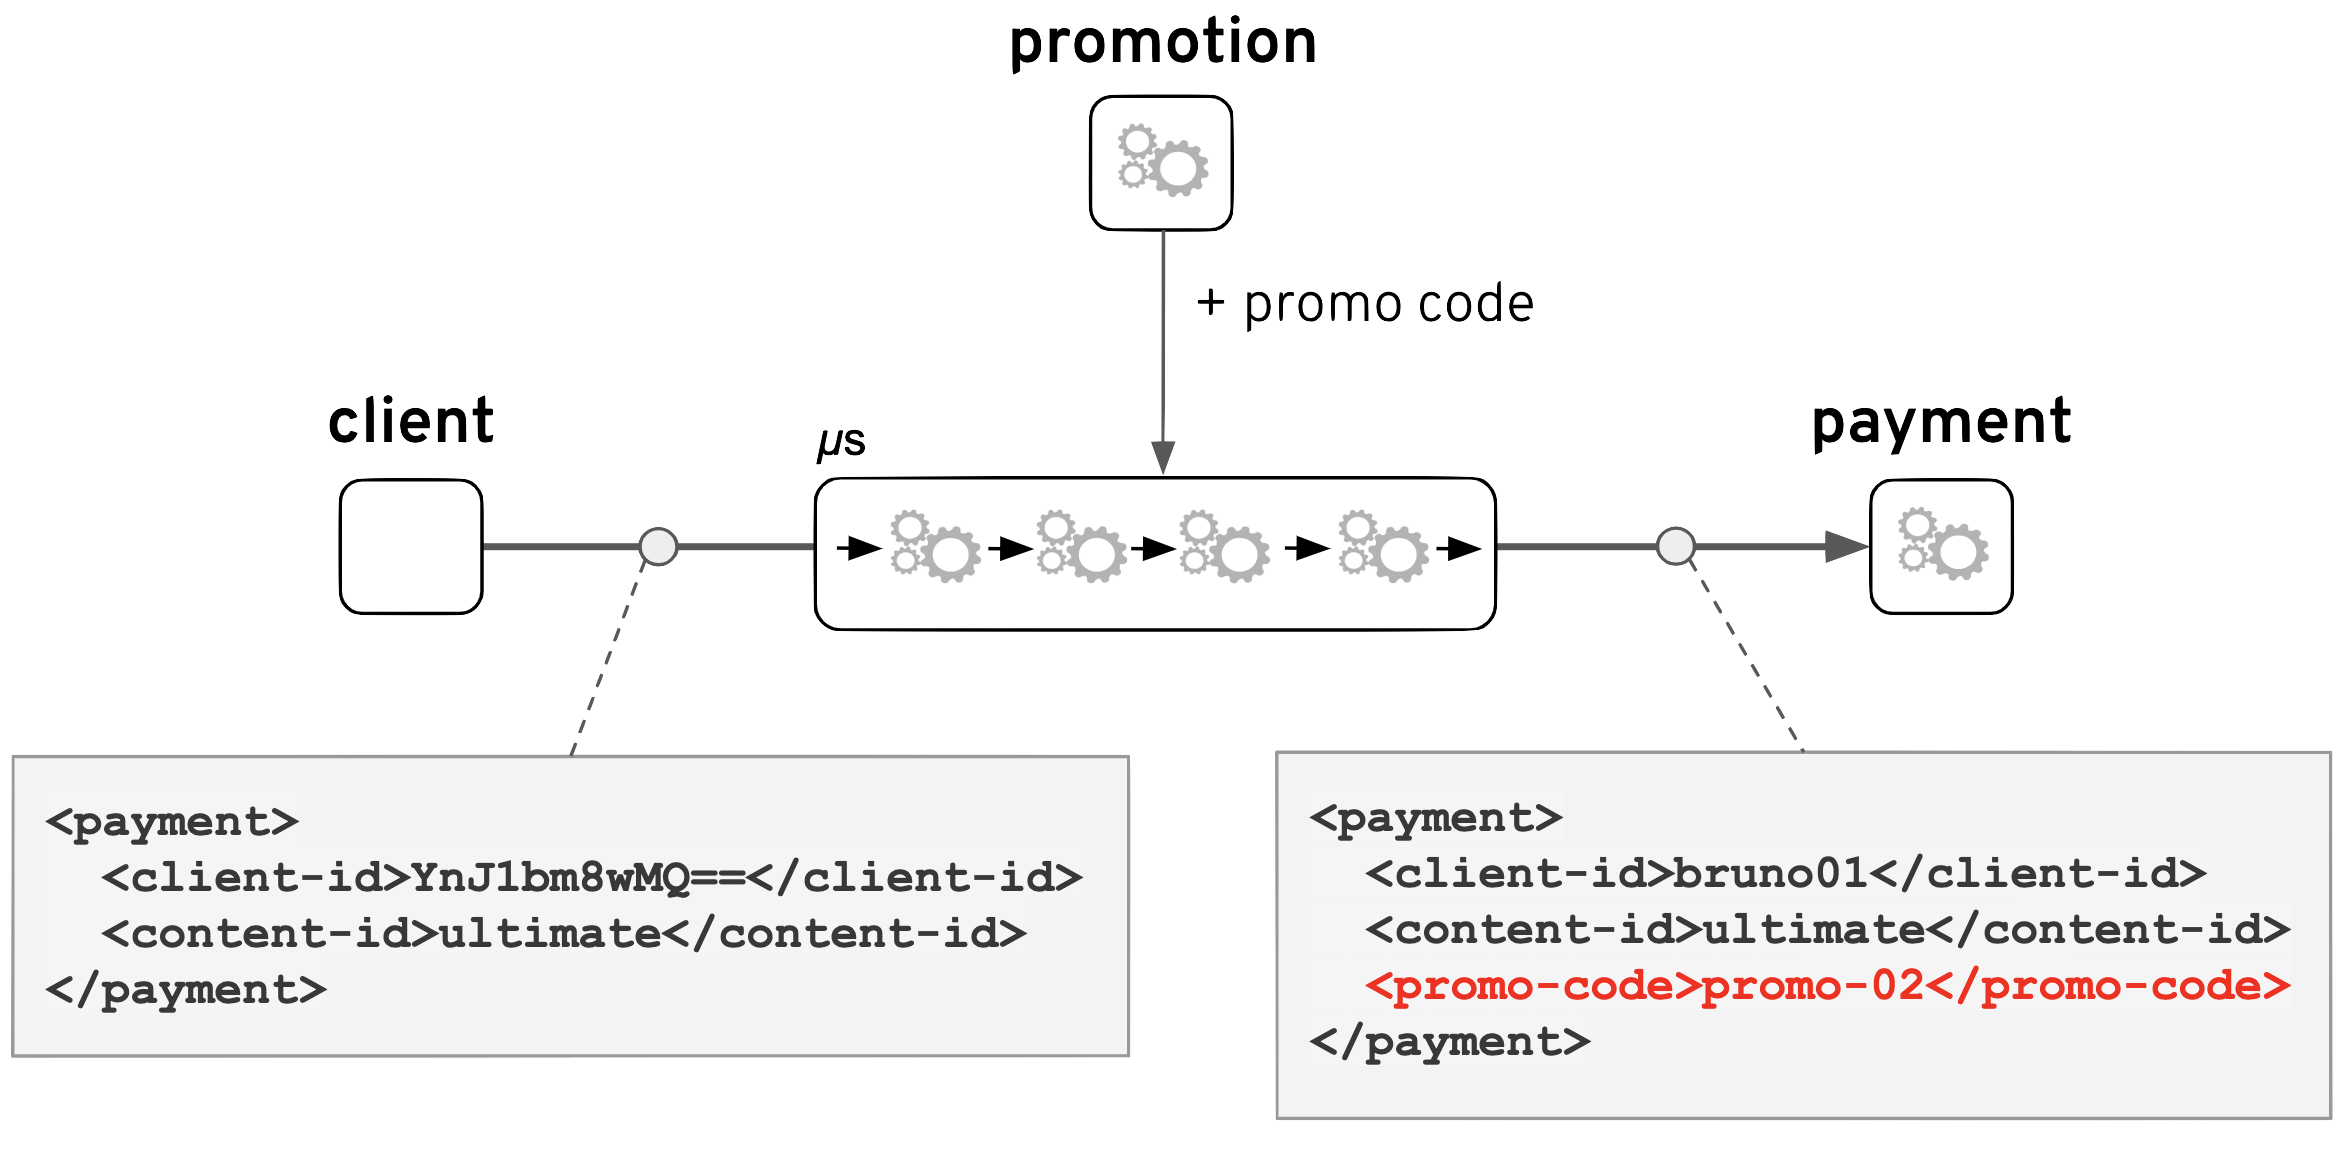
It becomes evident the flow has enriched the incoming request with a discount code automatically injected, obtained from the Promotion service.
When they contact and enquire the Marketing team they discover the new promotion was deployed, but missed to coordinate well with the Payment team for them to properly register the code in their systems.
The default behaviour of the backend Payment service is to abort a payment if the discount is not found to prevent charging the full amount in case the customer made a mistake when entering the promotion code. This allows the customer to retry the operation with a valid discount.
The problem here was the new integration functionality was automatically adding a promotion code as a reward for loyal customers, and because the system was misconfigured it was consequently aborting the payment. Customers happen to be completely unaware about this new automatism happening behind the scenes, and were just getting the failure responses.
Now the case has been fully understood by all the teams and they know how to proceed to resolve it. The example tries to highlight how important it is to have observability tools, and even more, to show how crucial it is for teams to learn how to coordinate the different perspectives to gain depth in their investigations.
Error example
This one is a lot simpler. While above we saw the platform didn’t throw any errors, this second example illustrates the opposite case when it does throw explicit errors and how the graphical console can help to quickly spot them.
Let’s say, with the same group of systems, the Marketing team, owners of the Promotion service, decide to make a small update on their application. Their development team is pretty young, and make junior mistakes. Their first version of the system was configured to listen on the default base path, for instance, the following one:
/camel/promotion/service/{id}
And they updated the configuration with a more relevant value, for instance:
/marketing/promotion/service/{id}
So far so good, except they didn’t tell anyone… I’m sure you’re thinking this is not realistic. You would be surprised !
Obviously the above change will upset the stability of the integration Payment solution, but because it involves multiple systems, it is not necessarily straight forward to know where to look for the problem.
As soon as the operator gets a sample ‘client-id’ from the logs, he can obtain its ‘trace-id’ (as seen earlier) and inspect in the console the end-to-end interaction which would look like:
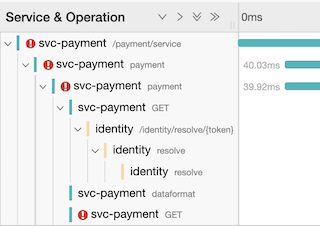
Immediately he can see there are interactions missing and he can identify the breaking point happening when calling the Promotion service. Something went wrong.
He then clicks on the Span to review the details, and the following information would be displayed:
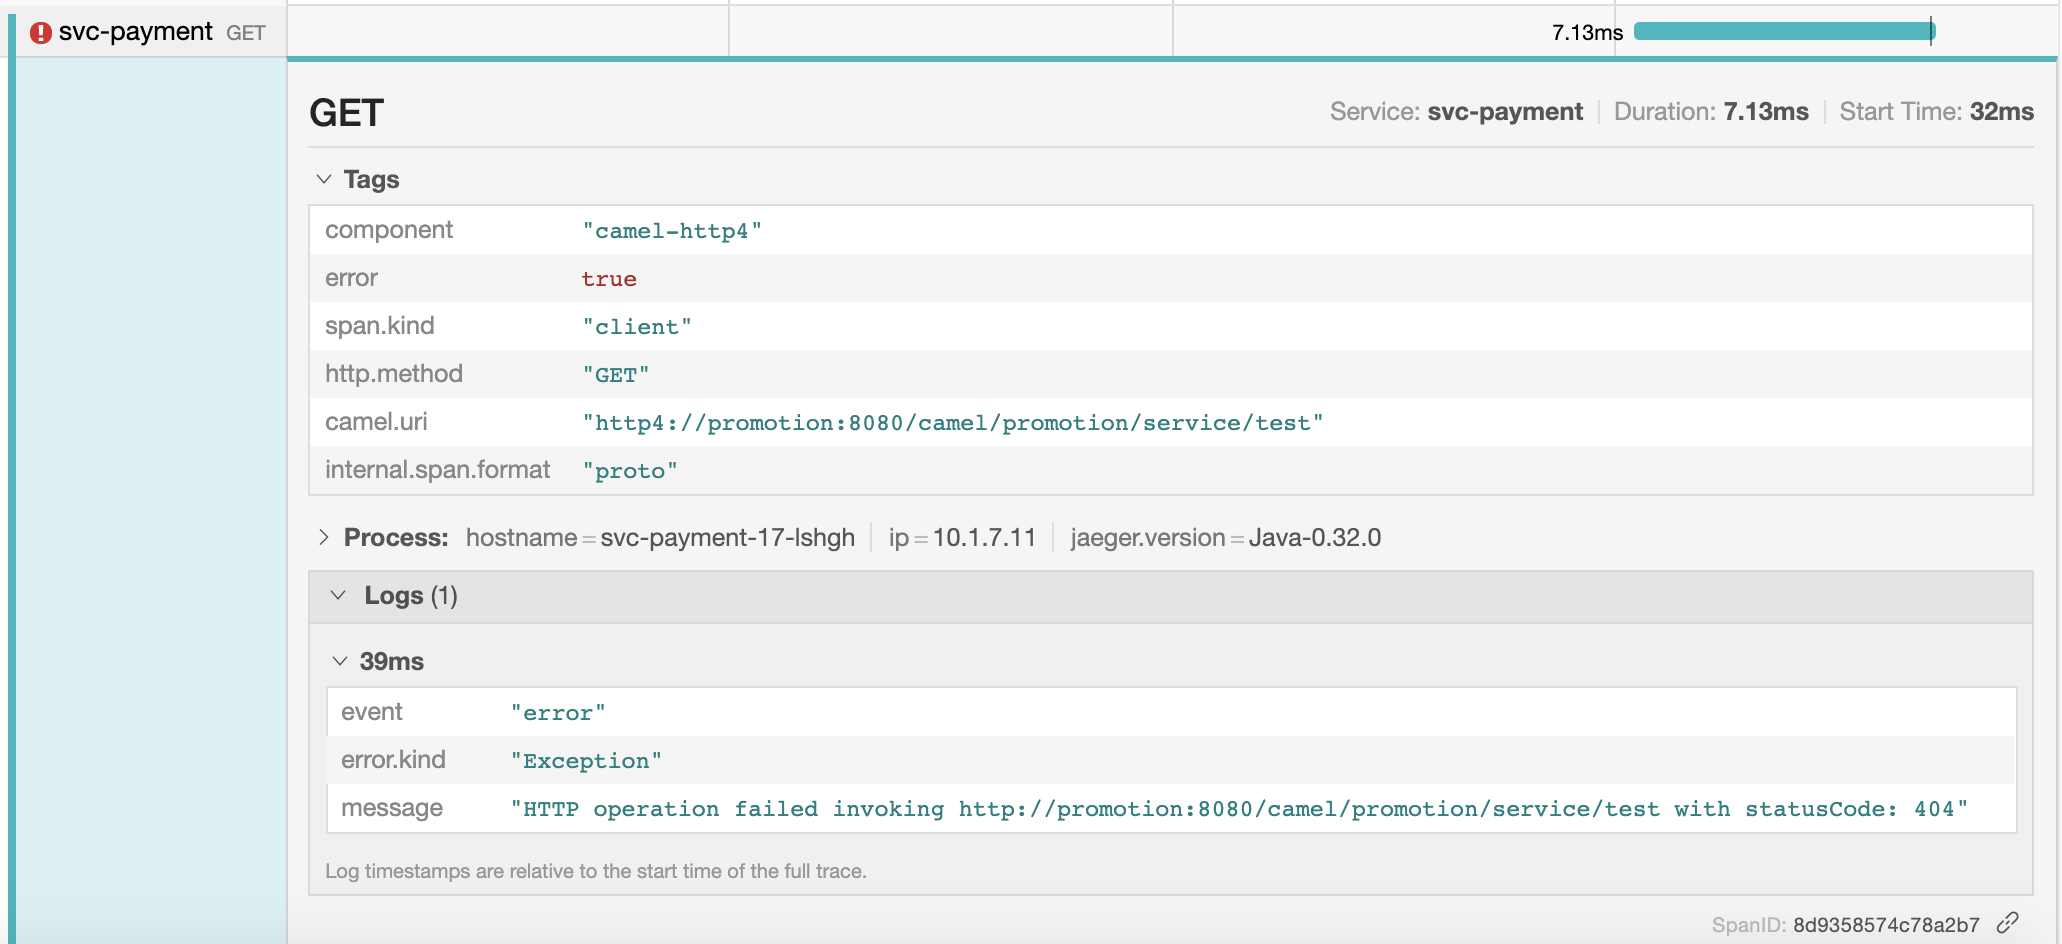
The logs show the backend responded with an HTTP error 404 (Not Found). He can share the details of the call with the Marketing team who will confirm the URL base path has changed.
Final words
Great tooling will always address well what it was designed for. However there will always be corner cases challenging your teams and impacting your organisation. To close the gap, it is important to learn how to extend it with extra functionality.
This is what this article aims to illustrate, and I hope you learnt a bit more, not only about general observability concepts, but also how to never get too comfortable, keep moving, and pave new roads to reach the place where you need to get.
When you’re in position to create (or rethink) the architecture of a platform, it’s definitely a good thing to plan for good observability strategies rather than adding on top of what already exists. The same reasoning applies if you have integration needs, it’s definitively advisable to plan well in advance, this is when Apache Camel becomes very relevant. You combine both, as you’ve seen all along the article, and you’ll have fantastic weapons to fight with.
Resources
All the source code produced to illustrate the examples in this article can be found in the following GitHub repository:
https://github.com/brunoNetId/example-camel-full-observability